

Aug 18 (newsonjapan.com) - Japanese candlesticks (Japanese candles) are one of the most popular tools for analyzing financial markets.
Traders worldwide use Japanese candles extensively for analyzing stocks, currencies, commodities, options, and cryptocurrencies. Online forex trading begins from what most traders today would consider unlikely; rice trading. Yet, it is a venture that popularized the ideas of one famous Japanese trader.
Ancient Commodity Trading
Trading is not a new activity; humans have traded an infinite amount of items over thousands of years. But ancient trading began to take shape and formal organization when livestock was the main commodity traded. Later, during the classical era, silver and gold started dominating trades. International trade boomed when bigger ocean vessels eased traveling, and traders could visit distant countries to bring back exotic goods. Economic and social events impact trading, and that's why at different points in the history of trading, workers sometimes get paid for certain commodities with high market values. For example, shepherds could be given some livestock as payment, while feudal farmers received portions of farm produce. But it was also common to find soldiers, blacksmiths, and court officials paid with expensive items such as metal and agricultural commodities. That's where the history of Japanese candlesticks took form.
How Japanese Candlesticks Developed
In 18th century Japan, the Samurai had control of the government and were popular, not just for their fighting skills but also for their business acumen. Samurais received a measure of rice as payment for their services. Rice was a popular commodity in Japan, forming an essential part of daily meals and the main ingredient for making Sake, a popular drink. Rice was in high demand. One day, a Samurai named Sokyu Honma, who lived in Sakata, Japan, between 1716 and 1803) entered the rice market. Sokyu Honma, also went by a more popular name, Munehisa Homma. He would go on to become a wealthy rice trader and the ancient father of what is called Japanese candlesticks.
Munehisa noticed several things about rice trading, including the impact of seasons and farming and the market and perceived values of rice. He started studying the price movement of rice and made deductions from his studies. Munehisa identified certain traits and trends in the rice market and their triggers and impact. He later developed a trading strategy that made him a wealthy rice trader. He based his strategy on five techniques and named it the Sakata Five. The techniques were adapted to create modern technical analysis. Munehisa kept his strategy to himself, but in 1775, he wrote a book called the 'Fountain of Gold' describing his observations, deductions, techniques, and strategies. Munehisa attained a god-like status among traders and rose to the enviable position of Financial Adviser to the government.
From Japan To the West
The Fountain of Gold remained in Japan, where traders all over Asia started to study and implement the trading techniques. Traders adapted the techniques to suit their markets and trading style. It took a long time before the world outside Asia would catch up to this new strategy. In the late 80s, Steve Nison began translating Japanese manuscripts on trading techniques, and in 1991, he published his book, Japanese Candlestick Charting Techniques. Nison's book quickly gained the attention of top traders, who started studying and practicing the techniques. The book's advent coincided with the period of modernizing financial markets and trading. Today, Japanese candlesticks are used in technical analysis for trading any financial need and on any platform with charts.
Modern Forex Trading and Japanese Candlesticks
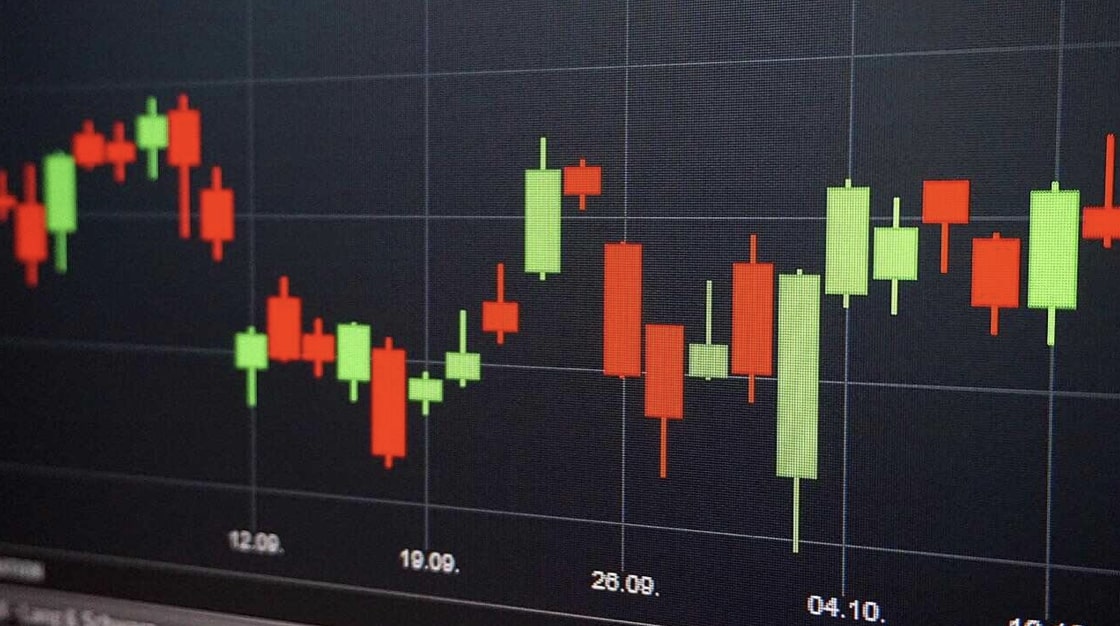
It is correct to say that Japanese candlesticks played a crucial role in modernizing forex trading. The earliest traders had a difficult time analyzing assets and price movements. They primarily relied on fundamental analysis and predictions. But today, forex traders have access to modern tools that gives them real-time insight into price action. As a forex trader, you don't have to rely on fundamental news and predictions; you easily predict price movements by analyzing Japanese candlesticks. The popularity of Japanese candles among modern traders is due to three reasons:
- Candles are simple yet show more information than other charts.
- Candles are visually appealing.
- Candles are easy to read even when they form patterns.
Today, all digital forex brokers offer Japanese candlesticks so that traders can analyze the market. Candlesticks improve indicator-based technical analysis and help traders make informed decisions.
How Japanese Candle Works
Here's a brief description of how candlesticks form and what information they reveal at a glance.
Anatomy of a Candlestick
Every candlestick has two parts; the wick and the body.
- The wick is either of two vertical lines that extend from the body and end at the upper or lower end of the candlestick. The wick is also called a shadow.
- The body of a Candlestick is the vertical cylindrical shape that forms between the upper and lower wicks.
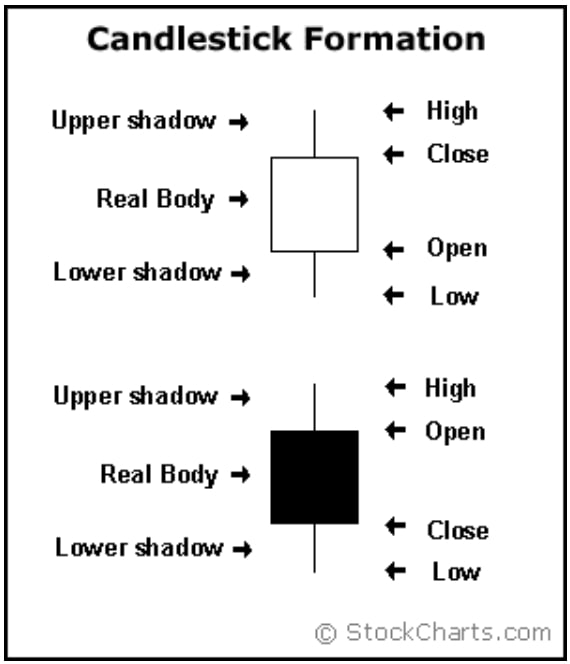
Candlestick formation
Japanese candlesticks form when based on the movement of an asset's price within a period, ranging from 1-minute to a year. Once the price moves, even for a minute, a candlestick appears. Candlesticks show an asset's opening and closing prices, the range of price increases and decreases, and the intensity of the price movement. Here's what each part of a candlestick shows:
- The wick: the wick of candlesticks shows the extent to which price moves from its opening point and where it eventually stops within a timeframe.
- The body: the body of a candle shows the intensity or volume of price movement. The more intense traders buy or sell, the thicker the body.
Types of Japanese Candles
Japanese candlesticks form once per time. Although only one candlestick forms in a timeframe, one or more candlesticks eventually form patterns. There are different individual candlesticks and candlestick patterns. Some of these are:
- Doji
- Harami
- Hammer
- Spinning top
- Hanging man
- Inverter hammer
These candlesticks combine to form a wide range of patterns under the Bullish Reversal Candlestick pattern, Bearish Reversal Candlestick pattern, and the Continuation Candlestick pattern. Understanding Japanese candlesticks will improve your trading performance and help you make better trading decisions.